Machine learning implementation in the interpretation of geophysical data Ana Brcković Gruić, PhD
Autor: Ana Brcković Gruić, PhD
The main objective of this study was to correlate sandstone deposits, confirmed in existing wells, across areas where no well data are available. This type of correlation between wells represents one of the greatest challenges in geological and geophysical interpretation. How can the spatial distribution of rocks be reconstructed when data are only available locally?
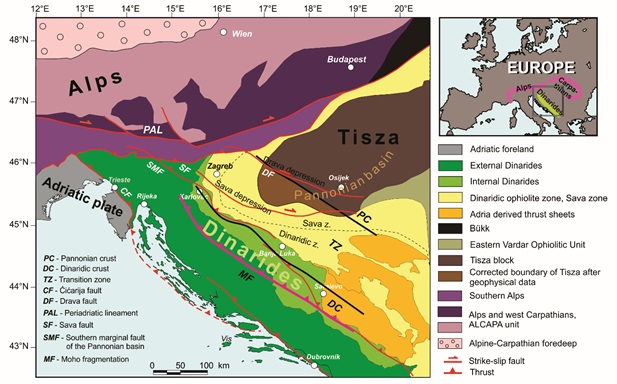
The most direct insight into the subsurface is provided by well data and core samples, which allow for precise determination of lithological composition and physical rock properties. However, these data are always limited to a very narrow spatial extent (Telford et al., 2004). For this reason, seismic data are traditionally used to fill the gaps between wells (Figure 1). Interpretation is based on the principle of superposition and the ability to track horizons laterally. However, the assumption that seismic signals can be uniquely associated with geological boundaries is often not valid in practice due to noise, variable resolution, and geological complexity. As a result, reliably correlating sandstone bodies of channel infills within a progradational delta becomes very difficult (Vukadin and Čikeš, 2017).
This is where machine learning comes into play, as it has increasingly transformed interpretation workflows across many scientific fields over the past two decades. The goal is not to replace the interpreter, but to accelerate and enhance steps that are still largely performed manually, such as data cleaning, pattern recognition, and prediction of subsurface properties where measurements are missing (Banas et al., 2021; McDonald, 2021).
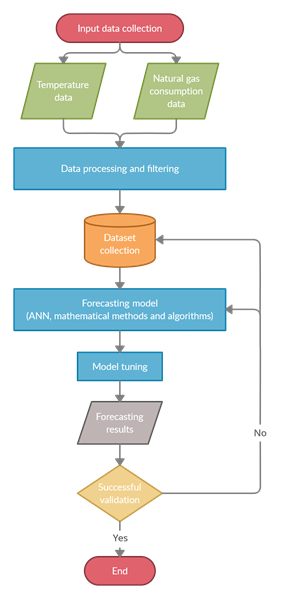
In this study, several approaches were applied: algorithms for noise removal from well log data (IF, SVM, LOF), models for predicting well log curves at locations without measurements (with the Long Short-Term Memory neural network achieving the best results) (Figure 2), and Self-Organizing Map clustering on seismic data to determine the distribution of rock types without predefined classification (Chaveste et al., 2023; Li and Gao, 2023) (Figure 3). In addition, a semi-automatic approach for seismic horizon extraction was developed using a greedy local optimization algorithm, enabling a more precise definition of reservoir body geometry.
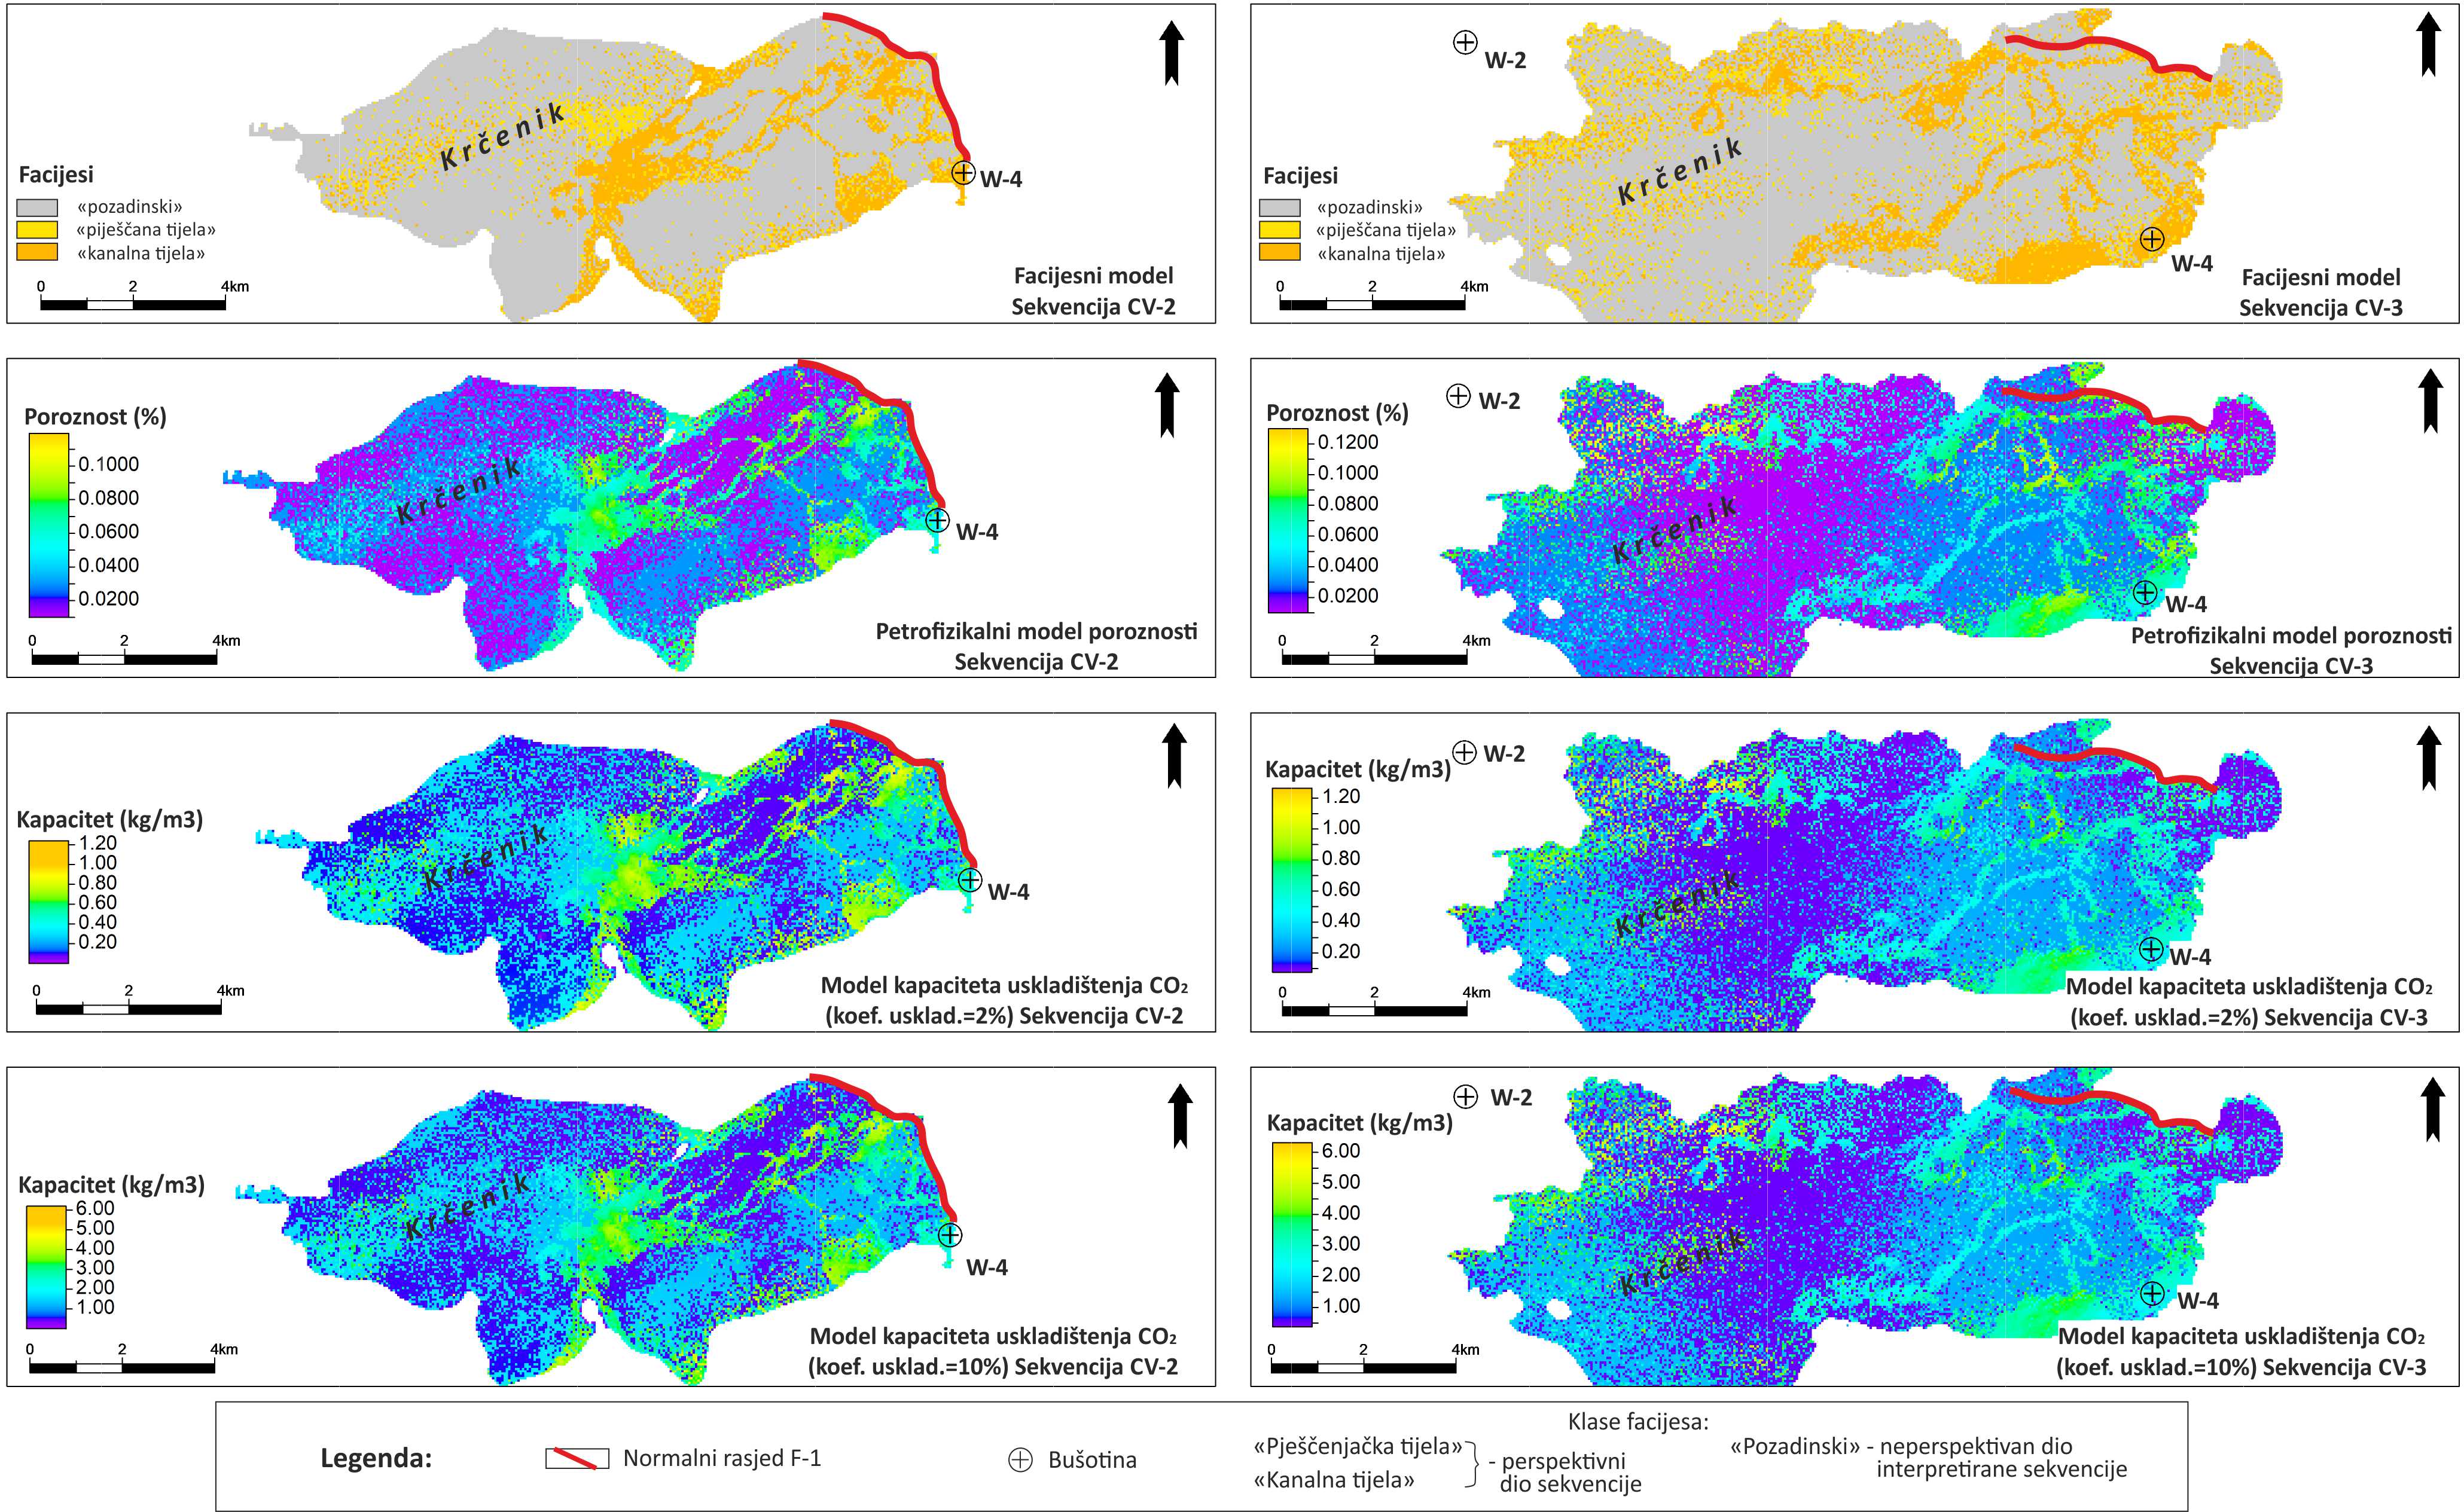
All methods were applied in the Drava Basin, resulting in the first geological model of the spatial distribution of sandstone reservoir bodies in the northwestern part of the Gola field created entirely using Python (Brcković et al., 2026) (Figure 4). The research was conducted using extensive datasets and with expert support from INA d.d..
The study demonstrates that machine learning can be an extremely valuable tool in geophysical interpretation. It enables faster analyses, detection of hidden patterns, and more reliable conclusions while still requiring the constant “watchful eye” of the interpreter, which remains indispensable.
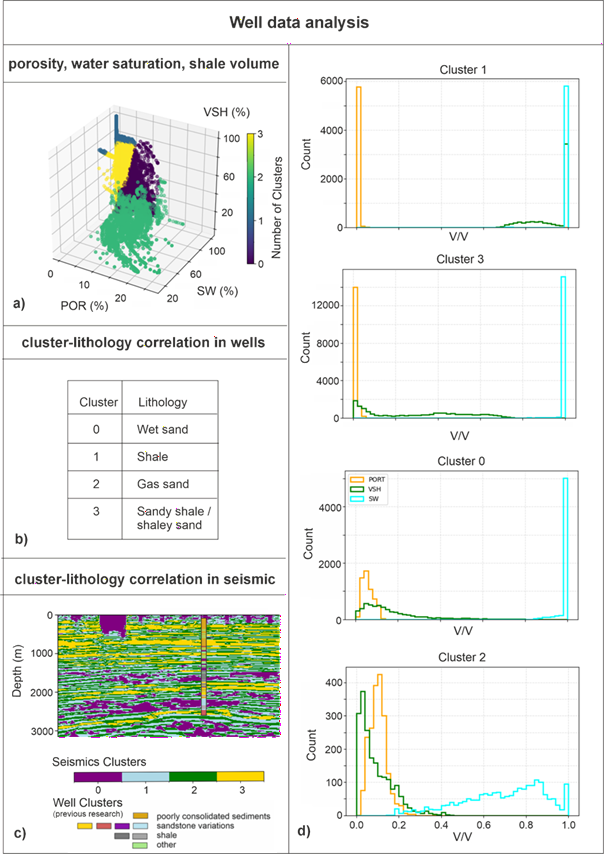
Figure 1. The correlation between clusters and lithological composition is based on:
(a) porosity (POR), water saturation (SW), and shale volume (VSH) derived from well log data, showing the grouping of well data based on these parameters; (b) the different lithological compositions that can be identified from this grouping; (c) following the assumption that identical lithologies should be distinguishable in seismic data, four seismic clusters correspond to the well-based grouping; (d) the definition of the four clusters is based on the distribution of POR, VSH, and SW in the well data.
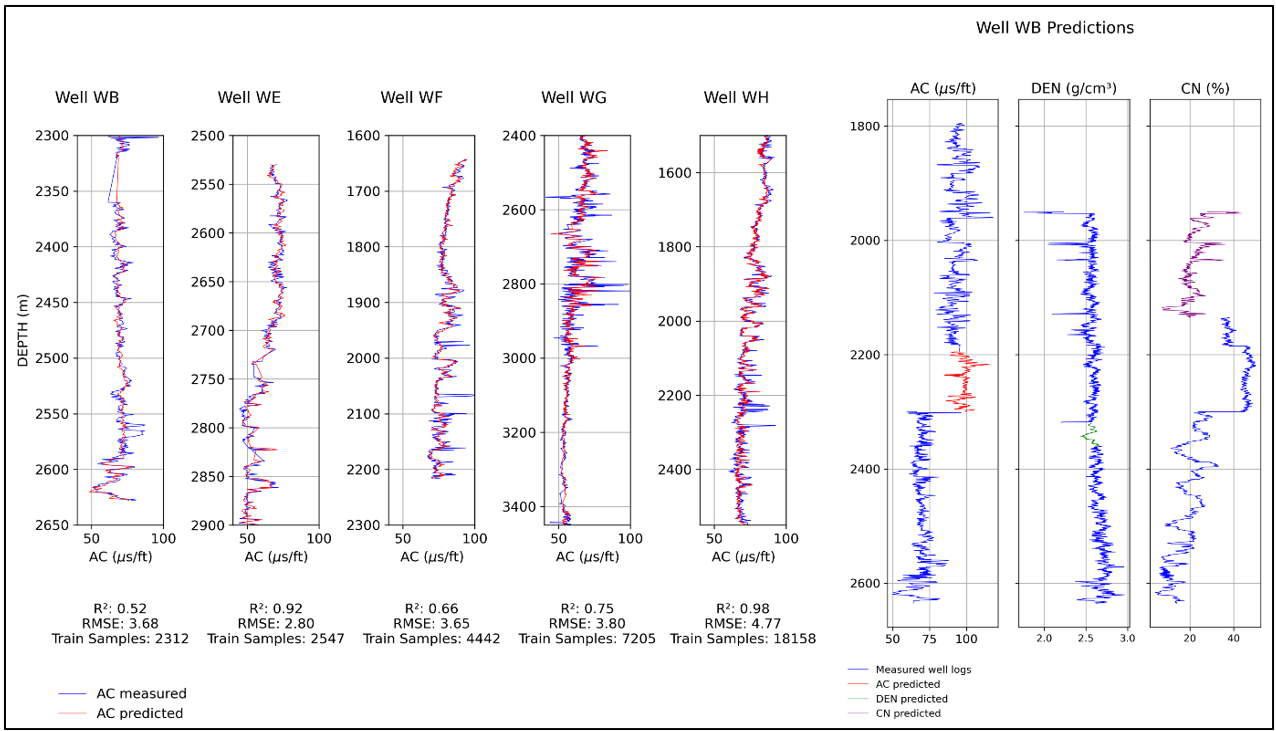
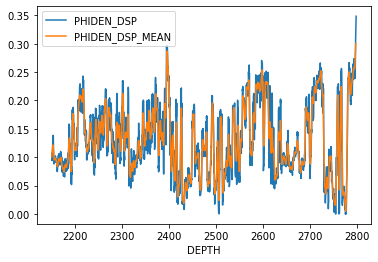
Figure 2. Comparison of predicted values (red) against measured values (blue) for wells WB, WE, WF, WG, and WH, with the coefficient of determination (R²) and root mean square error (RMSE) used as evaluation metrics (left); and the prediction of sonic (AC), density (DEN), and compensated neutron (CN) logs using an LSTM neural network in well WB (right).
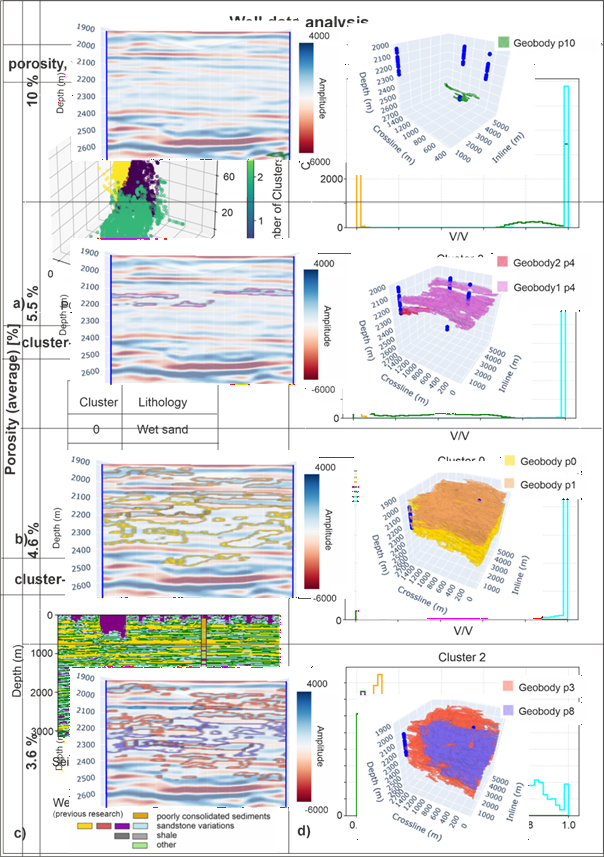
Figure 3. Correlation of sandstone bodies identified through SOM-based interpretation of seismic data, validated using porosity measurements from wells. It can be observed that average porosity values assigned to sandstone deposits are generally higher in vertically and laterally smaller, more confined bodies.
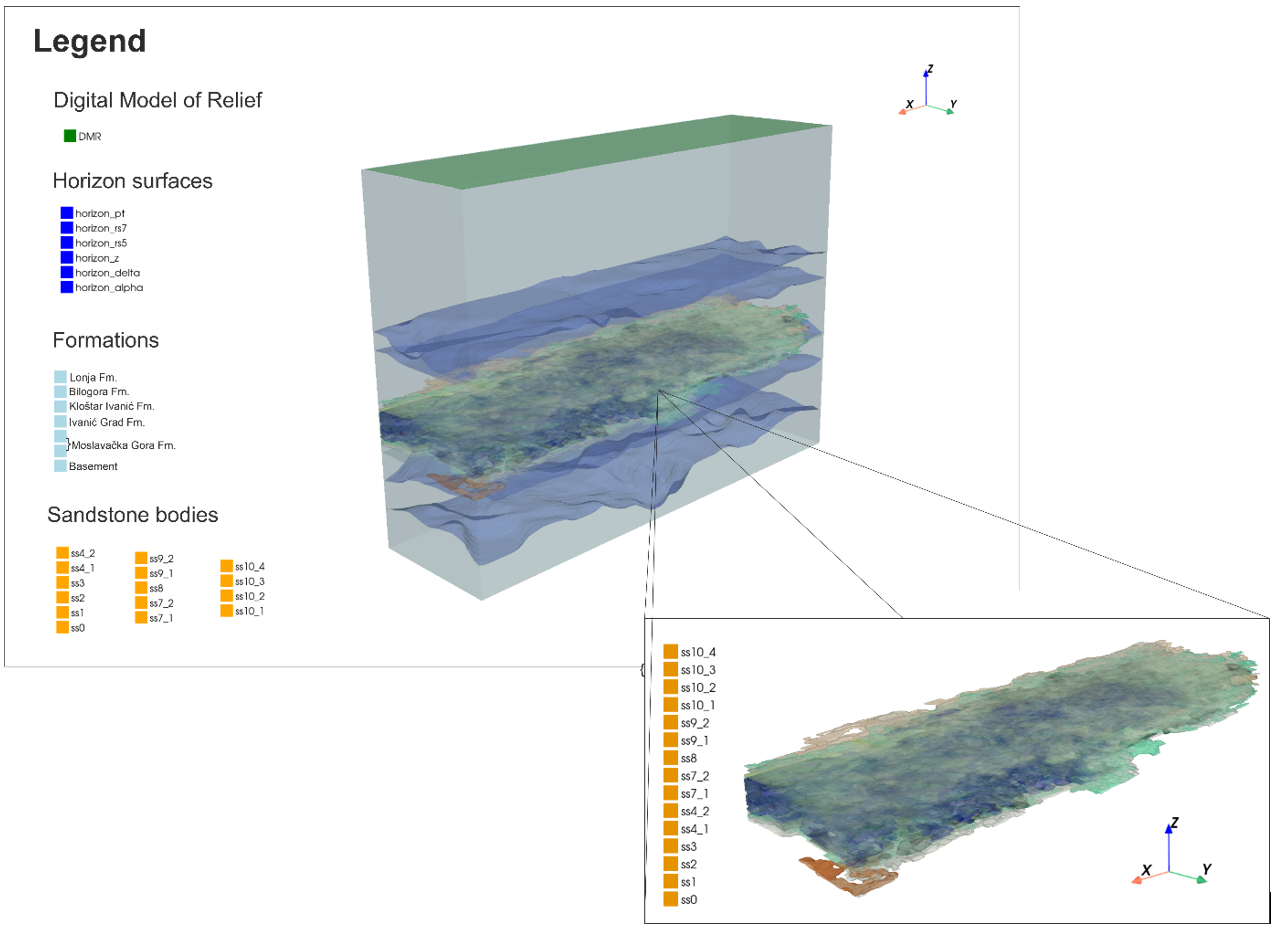
Figure 4. Geological model of the Gola field developed using a Python-based framework, including a digital elevation model (DEM), horizon surfaces (automatically extracted using a greedy algorithm), and 14 geobodies representing potential sandstone reservoirs with varying petrophysical properties (identified using unsupervised learning methods).
References
Telford, W. M., Geldart, L.P., Sheriff, R.E. (2004): Applied Geophysics, Second Edition. Cambridge University Press. Cambridge
Vukadin, D., & Čikeš, K. (2017). Using seismic inversion and seismic stratigraphy as a combined tool for understanding a small scale turbidite systems: Gola field, Pannonian basin, Croatia. https://www.researchgate.net/publication/341569134
Banas, R., McDonald, A., & Perkins, T. (2021, May 17). NOVEL METHODOLOGY FOR AUTOMATION OF BAD WELL LOG DATA IDENTIFICATION AND REPAIR. SPWLA 62nd Annual Online Symposium Transactions. https://doi.org/10.30632/SPWLA-2021-0070
McDonald, A. (2021). Data Quality Considerations for Petrophysical Machine-Learning Models. In Petrophysics (Vol. 62, Number 6, pp. 585–613). Society of Petroleum Engineers (SPE). https://doi.org/10.30632/PJV62N6-2021a1
Chaveste, Alvaro, Roden, Rocky R., and Smith, Tom. 2023. Machine Learning-Based Method Provides Economic Option To Seismic Inversions Conventional Inversion. The American Oil & Gas Reporter, Volume 66, No. 11. 43-49.
Li, J., & Gao, G. (2023). Digital construction of geophysical well logging curves using the LSTM deep-learning network. Frontiers in Earth Science, 10. https://doi.org/10.3389/feart.2022.1041807
Brcković, A., Vukadin, D., Medved, I., & Orešković, J. (2026). Reconstructing the Distribution of Turbiditic Gas Sandstones in the SW Pannonian Basin Using Machine Learning Methods. Geophysical Prospecting, 74(2). https://doi.org/10.1111/1365-2478.70146