

Autor: Ana Brcković, mag. geol.
Ambiguity of interpretation is a term that is characteristic for most of geophysical data andit showcases the impossibility of defining a single underground model based solely on measured data. This phenomenon is caused by the heterogeneity of the observed surrounding, or the fact that the properties of the rocks change in all directions, although these properties are mostly correlated (Klose, 2006). Ambiguity is greatly reduced by the application of different geophysical research methods, but different methods imply that the data collected are differently structured, very often at different intervals, and depending on the method in different dimensions also. Such examples are seismic and well data. Seismic data are most often collected within a predefined 3D cube (Figure 1) and geophysical parameters of the rocks are obtained using the velocities of waves propagating through the subsurface.

Figure 1 Transverse profiles within the 3D seismic cube (X and Y axes represent geographical coordinates, Z axis shows the amplitude of the seismic wave at twice the travel time)
On the other hand, well data is a set of 1D data where, depending on the probe used, geophysical parameters are observed in relation to depth (Figure 2).

Figure 2 Representation of well data from one well (blue curve shows the values of spontaneous potential on the basis of which permeable and impermeable rocks can be separated; green curve shows the natural radioactivity of drilled deposits, pink shows the propagation of sound waves, and red curve shows densities)
Linking of the data on different scales is achieved by making synthetic seismograms, which are used for modeling the wave through the drilled layers based on accoustic logs and density los.
In practice, not all the parameters mentioned are measured along the entire borehole channel, but only at interesting intervals where the reservoir rocks that may contain hydrocarbons are expected (Figure 2).
The collected measurement data must then be interpreted, the useful information needed to make a model of the surface must be read. The information we would like to get is diverse, ranging from different types of rocks (lithology), fractured zones (faults) and pores (porosity), all the way to different fluids content.
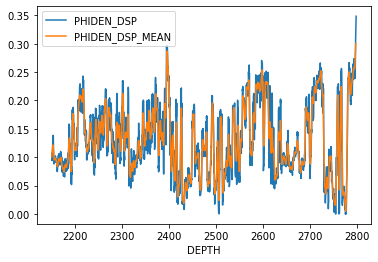
Figure 3 Calculated porosity values (blue) and average values (orange). Low values indicate more compact rocks with fewer pores and cracks, especially visible at the deepest part of the well (right). Higher values indicate rocks with more pore space in which different fluids can be found.
The implementation of machine learning methods can facilitate and improve the interpretation of measured data. With the help of certain algorithms, it is possible to more efficiently detect regularities in seemingly irregular data and group and characterize them based on that.
The self-organizing map (SOM) algorithm is a type of artificial neural network based on unsupervised data learning, which means that it does not use a test set to find similarities in the data, but analyzes the entire set at once (Kohonen, 1981). Different features can be recognized by displaying multidimensional data in the form of the clusters on a 2D map (Figure 4).

Figure 4 SOM structure (the network consists of input data and a layer of neurons with weighting factors based on whose distances the data are arranged into categories in the plane)
It is necessary to add labels to the organized clusters, and based on the output it is necessary to see whether the parameters within the network can be further adjusted for better resolution (Figure 5).

Figure 5 Seismic data dimensionaly reduced and clustered using SOM on the example of two seismic attributes (light areas show clusters with similar characteristics, and the darkest parts are the boundaries between clusters)
Based on the clustered data that are representing areas with similar characteristics in the subsurface, facies are classified in the researched area and geophysical parameters such as porosity or velocity of seismic waves are obtained at intervals with insufficient or incomplete well data (Junno, 2019).

Figure 6 Well data clustering by SOM (six categories of grouping based on 5 log curves from one well were assumed)
Reference:
Junno, N., Koivisto, E., Kukkonen, I., Malehmir, A., Montonen, M. (2019): Predicting Missing Seismic Velocity Values Using Self-Organizing Maps to Aid the Interpretation of Seismic Reflection Data from the Kevitsa Ni-Cu-PGE Deposit in Northern Finland; Minerals, pp 16
Kohonen, T. (1981): Automatic formation of topological maps of patterns in a self-organizing system. In Proceedings of the Second Scandinavian Conference on Image Analysis, Helsinki, Finland, 15–17; Springer: New York, NY, USA, 214–220.
Klose, C. D. (2006): Self-organizing maps for geoscientific data analysis: geological interpretation of multidimensional geophysical data. Computational Geosciences, 10, 265–277.
Taner, M. T., J. D. Walls, M. Smith, G. Taylor, M. B. Carr, and D. Dumas (2001): Reservoir characterization by calibration of self-organized map clusters. 71st Annual International Meeting, SEG, Expanded Abstracts, 20, 1522–1525.
Ana Brcković, mag. geol. je asistentica na Zavodu za geofizička istraživanja i rudarska mjerenja na Rudarsko-geološko-naftnom fakultetu Sveučilišta u Zagrebu.
E-portfolio Link
ResearchGate Link
Google Scholar Link
CROSBI Link