

Author: David Rukavina, PhD mag.geol., mag.ing.min.
The aim of the research is to present an estimate of the geological storage potential of carbon dioxide (CO2) based on the tectonostratigraphic interpretation of the Lower and Middle Miocene rocks within the eastern part of the Drava Depression. The Lower and Middle Miocene rocks are important regional reservoir rocks, as evidenced by the large number of Croatian oil and gas fields located in them (Velić, 2007). Such reservoir rocks can also be used for the purpose of geological storage of CO2, one of the most important methods of reducing human greenhouse gas emissions (Figure 1). Nevertheless, previous research of the same rocks in the underground is very limited and their regional correlation and research is lacking (Zečević et al., 2010).

Figure 1. Scheme of the geological storage of carbon dioxide options.
The reason for this is that these rocks are characterized by complex geological setting as a consequence of their formation within the continental rift system and subsequent tectonic processes. The Drava Depression is one of a dozen depressions i.e., basins that make up the Pannonian Basin System (PBS) (Figure 2). The formation of PBS is closely related to the extensional movements that occupied this area in the Miocene (Tari et al., 1992; Fodor et al., 1998; Horváth et al., 2006).
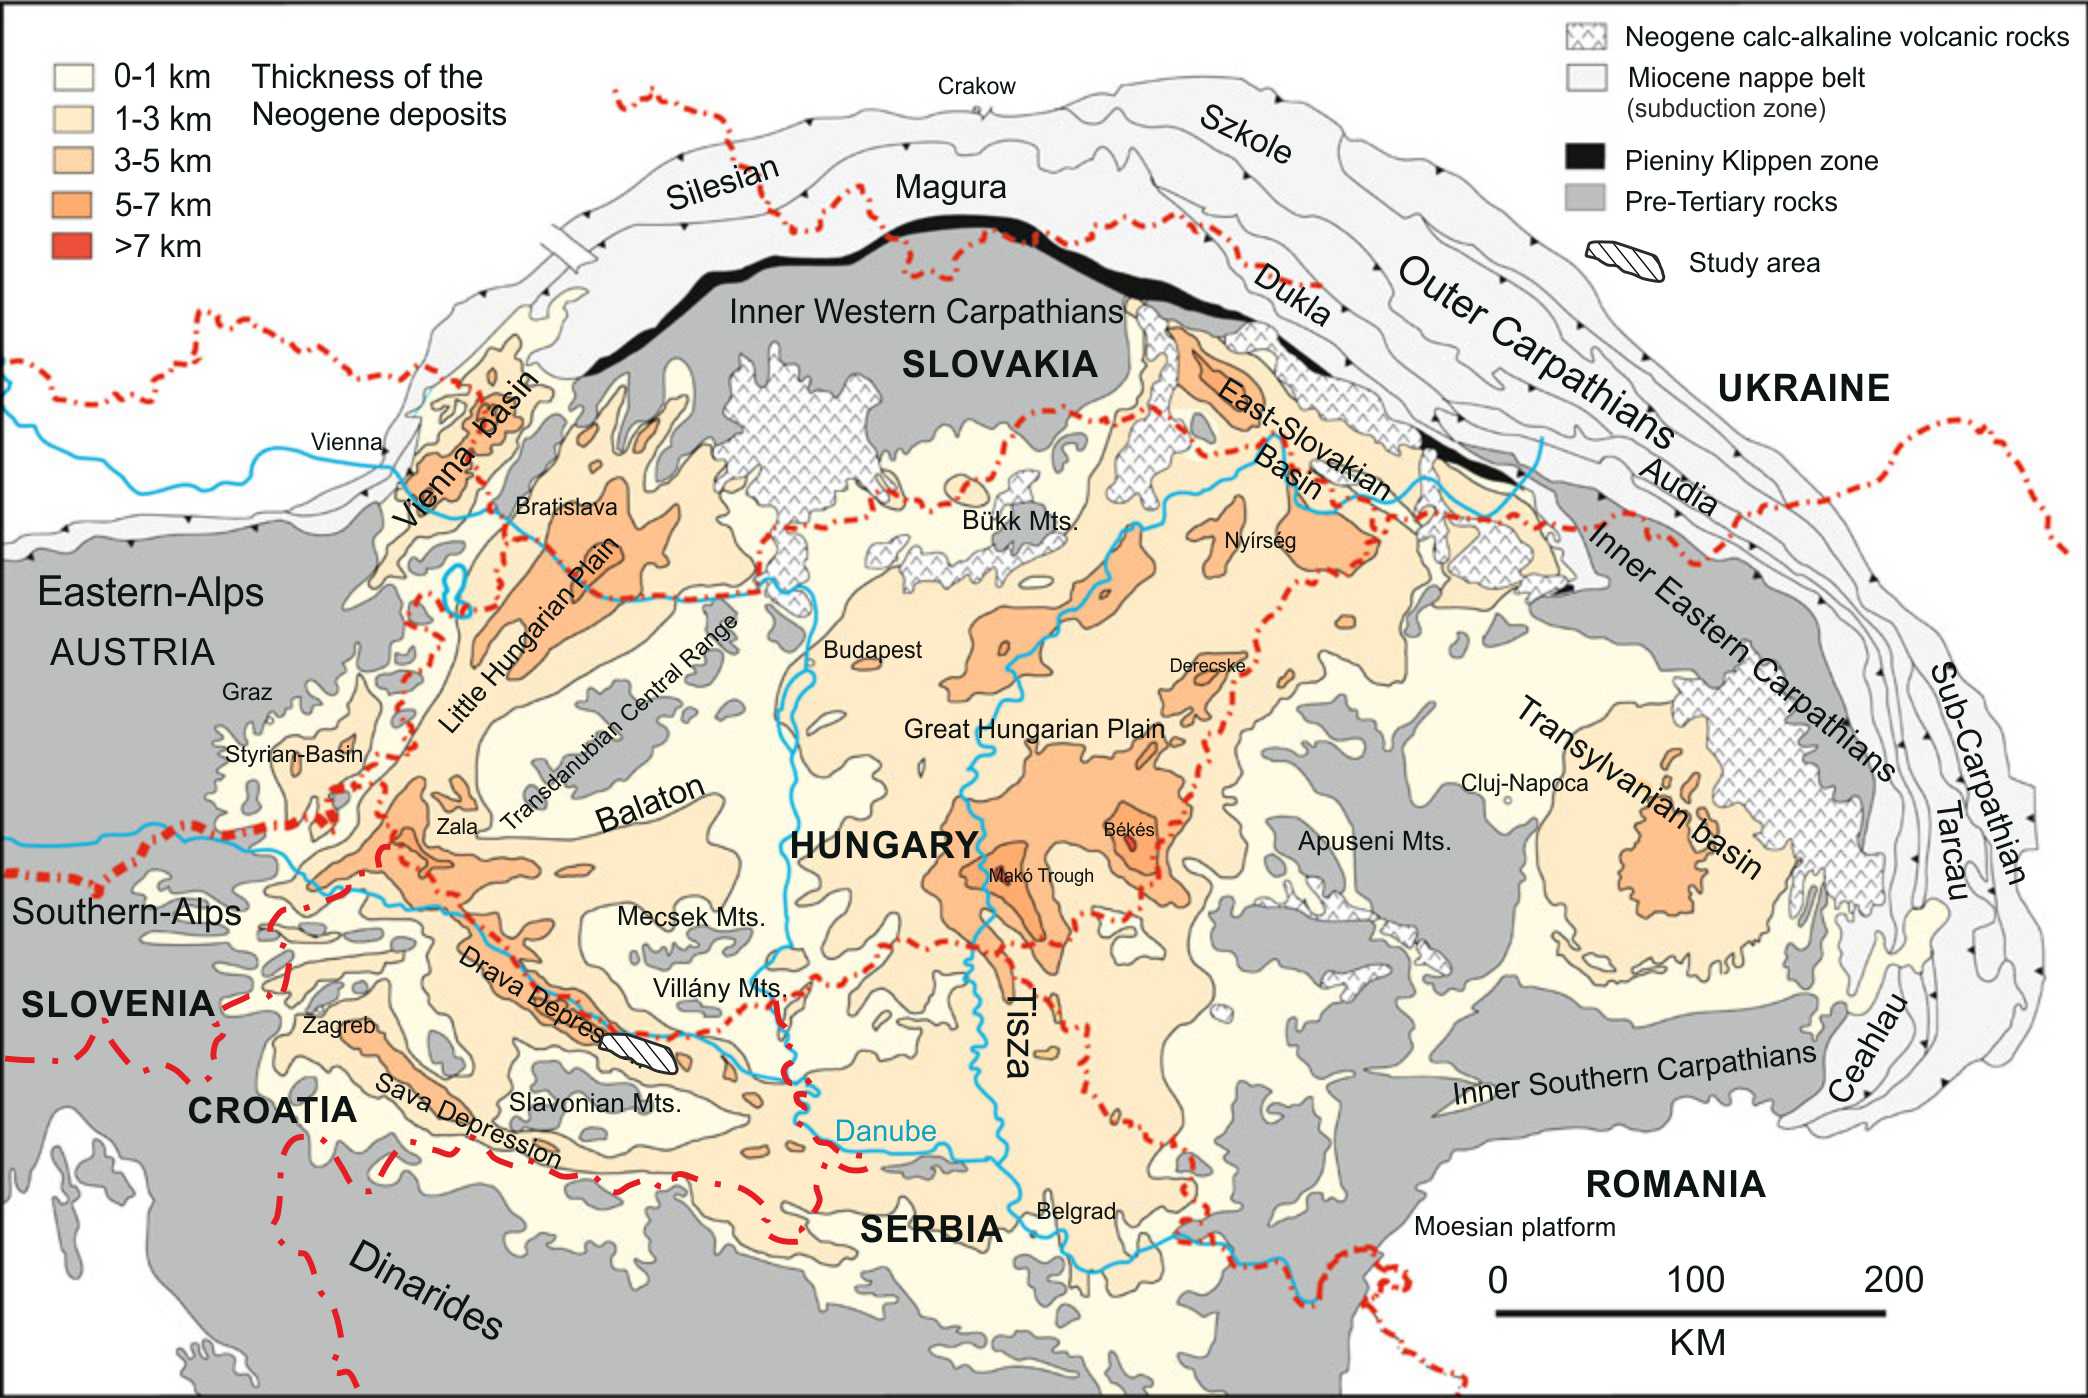
Figure 2. Neogene basins within the Pannonian Basin System (PBS) ((Csontos and Nagymarosy, 1998; Haas, 2012). The Miocene nappe belt delineates the area affected by “slab pull” and/or “subduction rollback” processes, causing extension within the PBS and the formation of Miocene sedimentation basins.
In continental or passive rift systems, extension is caused by the direct action of opposing forces in the lithosphere (Turcotte and Emerman, 1983). Such an extension is well documented in PBS (Figure 2), as a result of subduction processes, i.e., “slab pull” and/or “subduction rollback” (Royden and Burchfiel, 1989; Royden, 1993). Extension in the continental rift system is often associated with thinning of the crust and faulting along low angle detachment faults (Buck, 1988; Hodges et al., 1989; Tari et al., 1992). The tectonic history of continental rift basins is represented by a syn-rift phase, and consists of episodic tectonic movements, lateral rotation of basins around the axis and spatial migration of depocenters, making them more complex than other types of basins formed by stable tectonic subsidence (Wu et al., 2019).
Assessment of the geological storage potential of CO2 in such conditions involves the use and interpretation of seismic and well data. For this purpose, faults, sequence boundaries, seismofacies distribution, seismic attributes, lithofacies and content of planktonic foraminifera on rock samples were analyzed. Rock formation porosity values were then estimated based on well log measurements, together with temperature, pressure and density in reservoir conditions maps construction in order to calculate the theoretical capacity of geological storage of CO2. Tectonostratigraphic interpretation enabled the spatial correlation and mapping of Lower and Middle Miocene rocks based on the genetic association of syn-rift infill with fault activity.
The syn-rift phase is characterized by multiphase tectonic activity controlled by large low angle faults i.e., extensional detachment. In their hanging wall syn-rift structures such as half-graben, graben, sag, and supradetachment basin were formed along with a number of normal faults (Figure 3). Extensional movements are predisposed to reactivated inherited structures. Interpreted extensional detachments can be spatially connected into to the system of the main normal fault of the eastern part of the Drava Depression, which bounded the entire depositional area during the syn-rift.
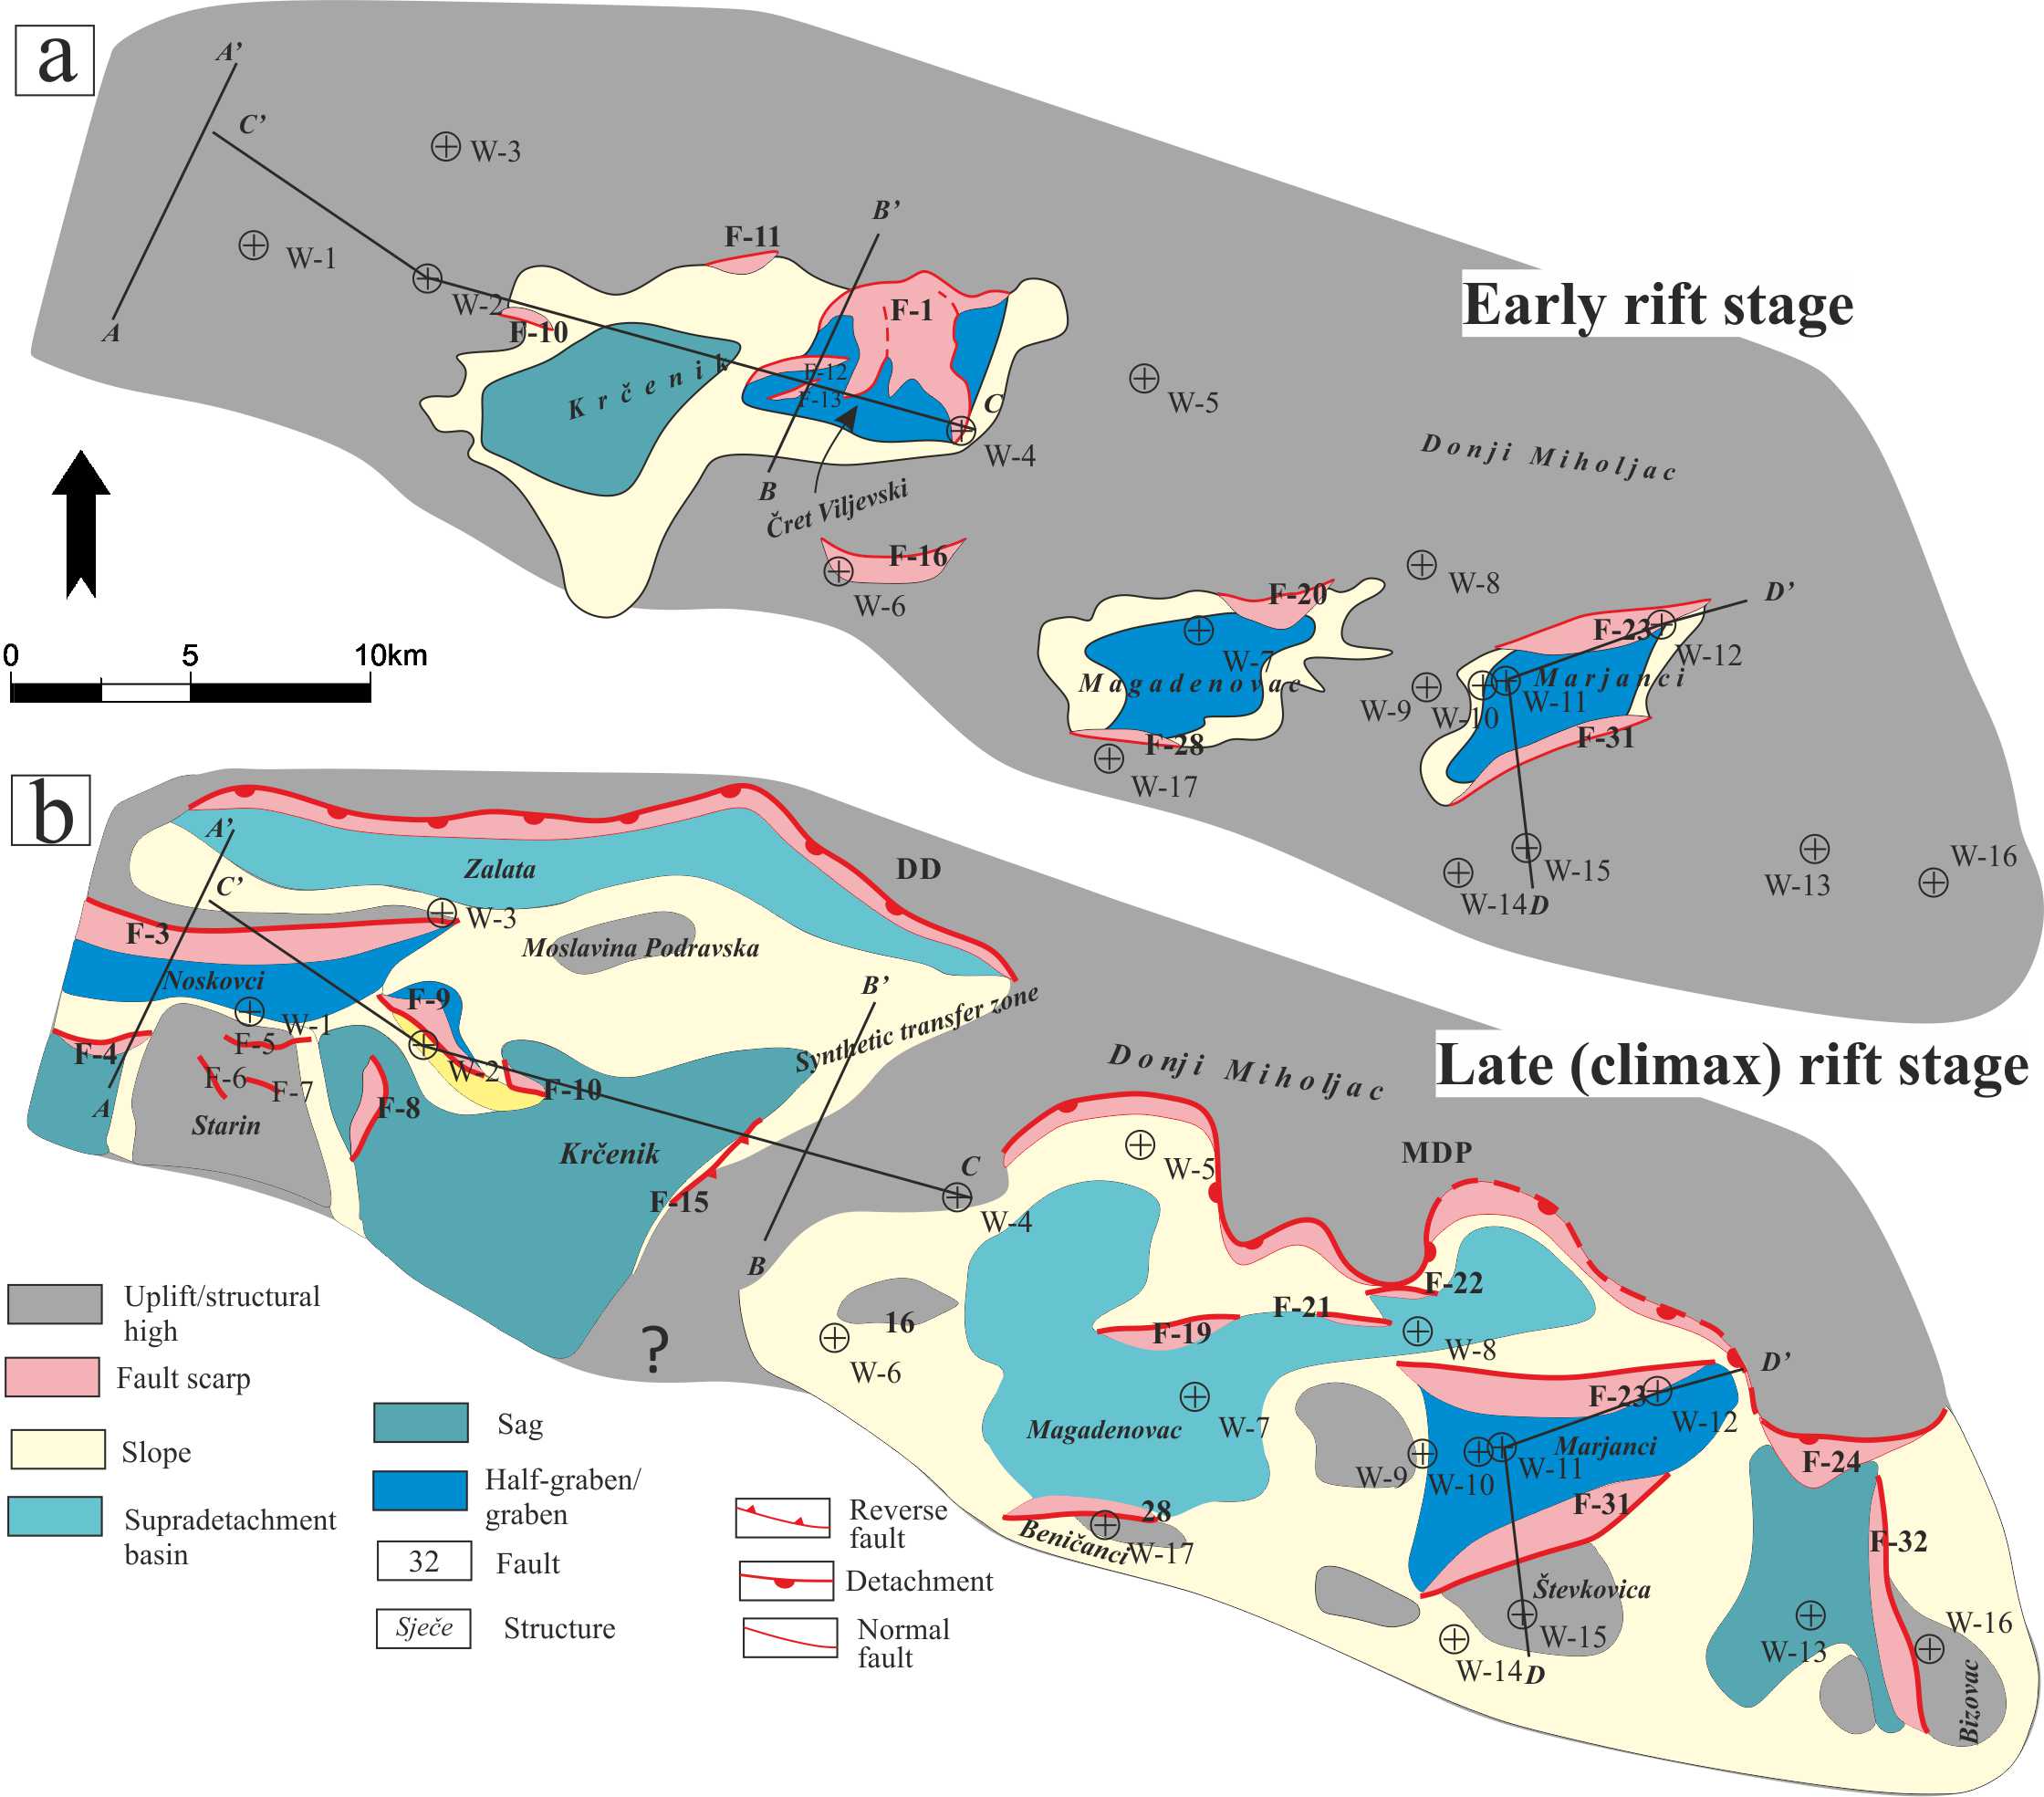
Figure 3. Maps of interpreted tectonic units: a) early rift phase and b) late rift phase.
Based on petrographic-sedimentological analysis, eight lithofacies were defined. These lithofacies are grouped into two associations, one representing deposits associated with predominantly continental environments and the other associated with marine environments. Within these lithofacies associations alluvial fan, fan deltas, transitional, fault aprons and deep-sea environments were interpreted (Figure 4).
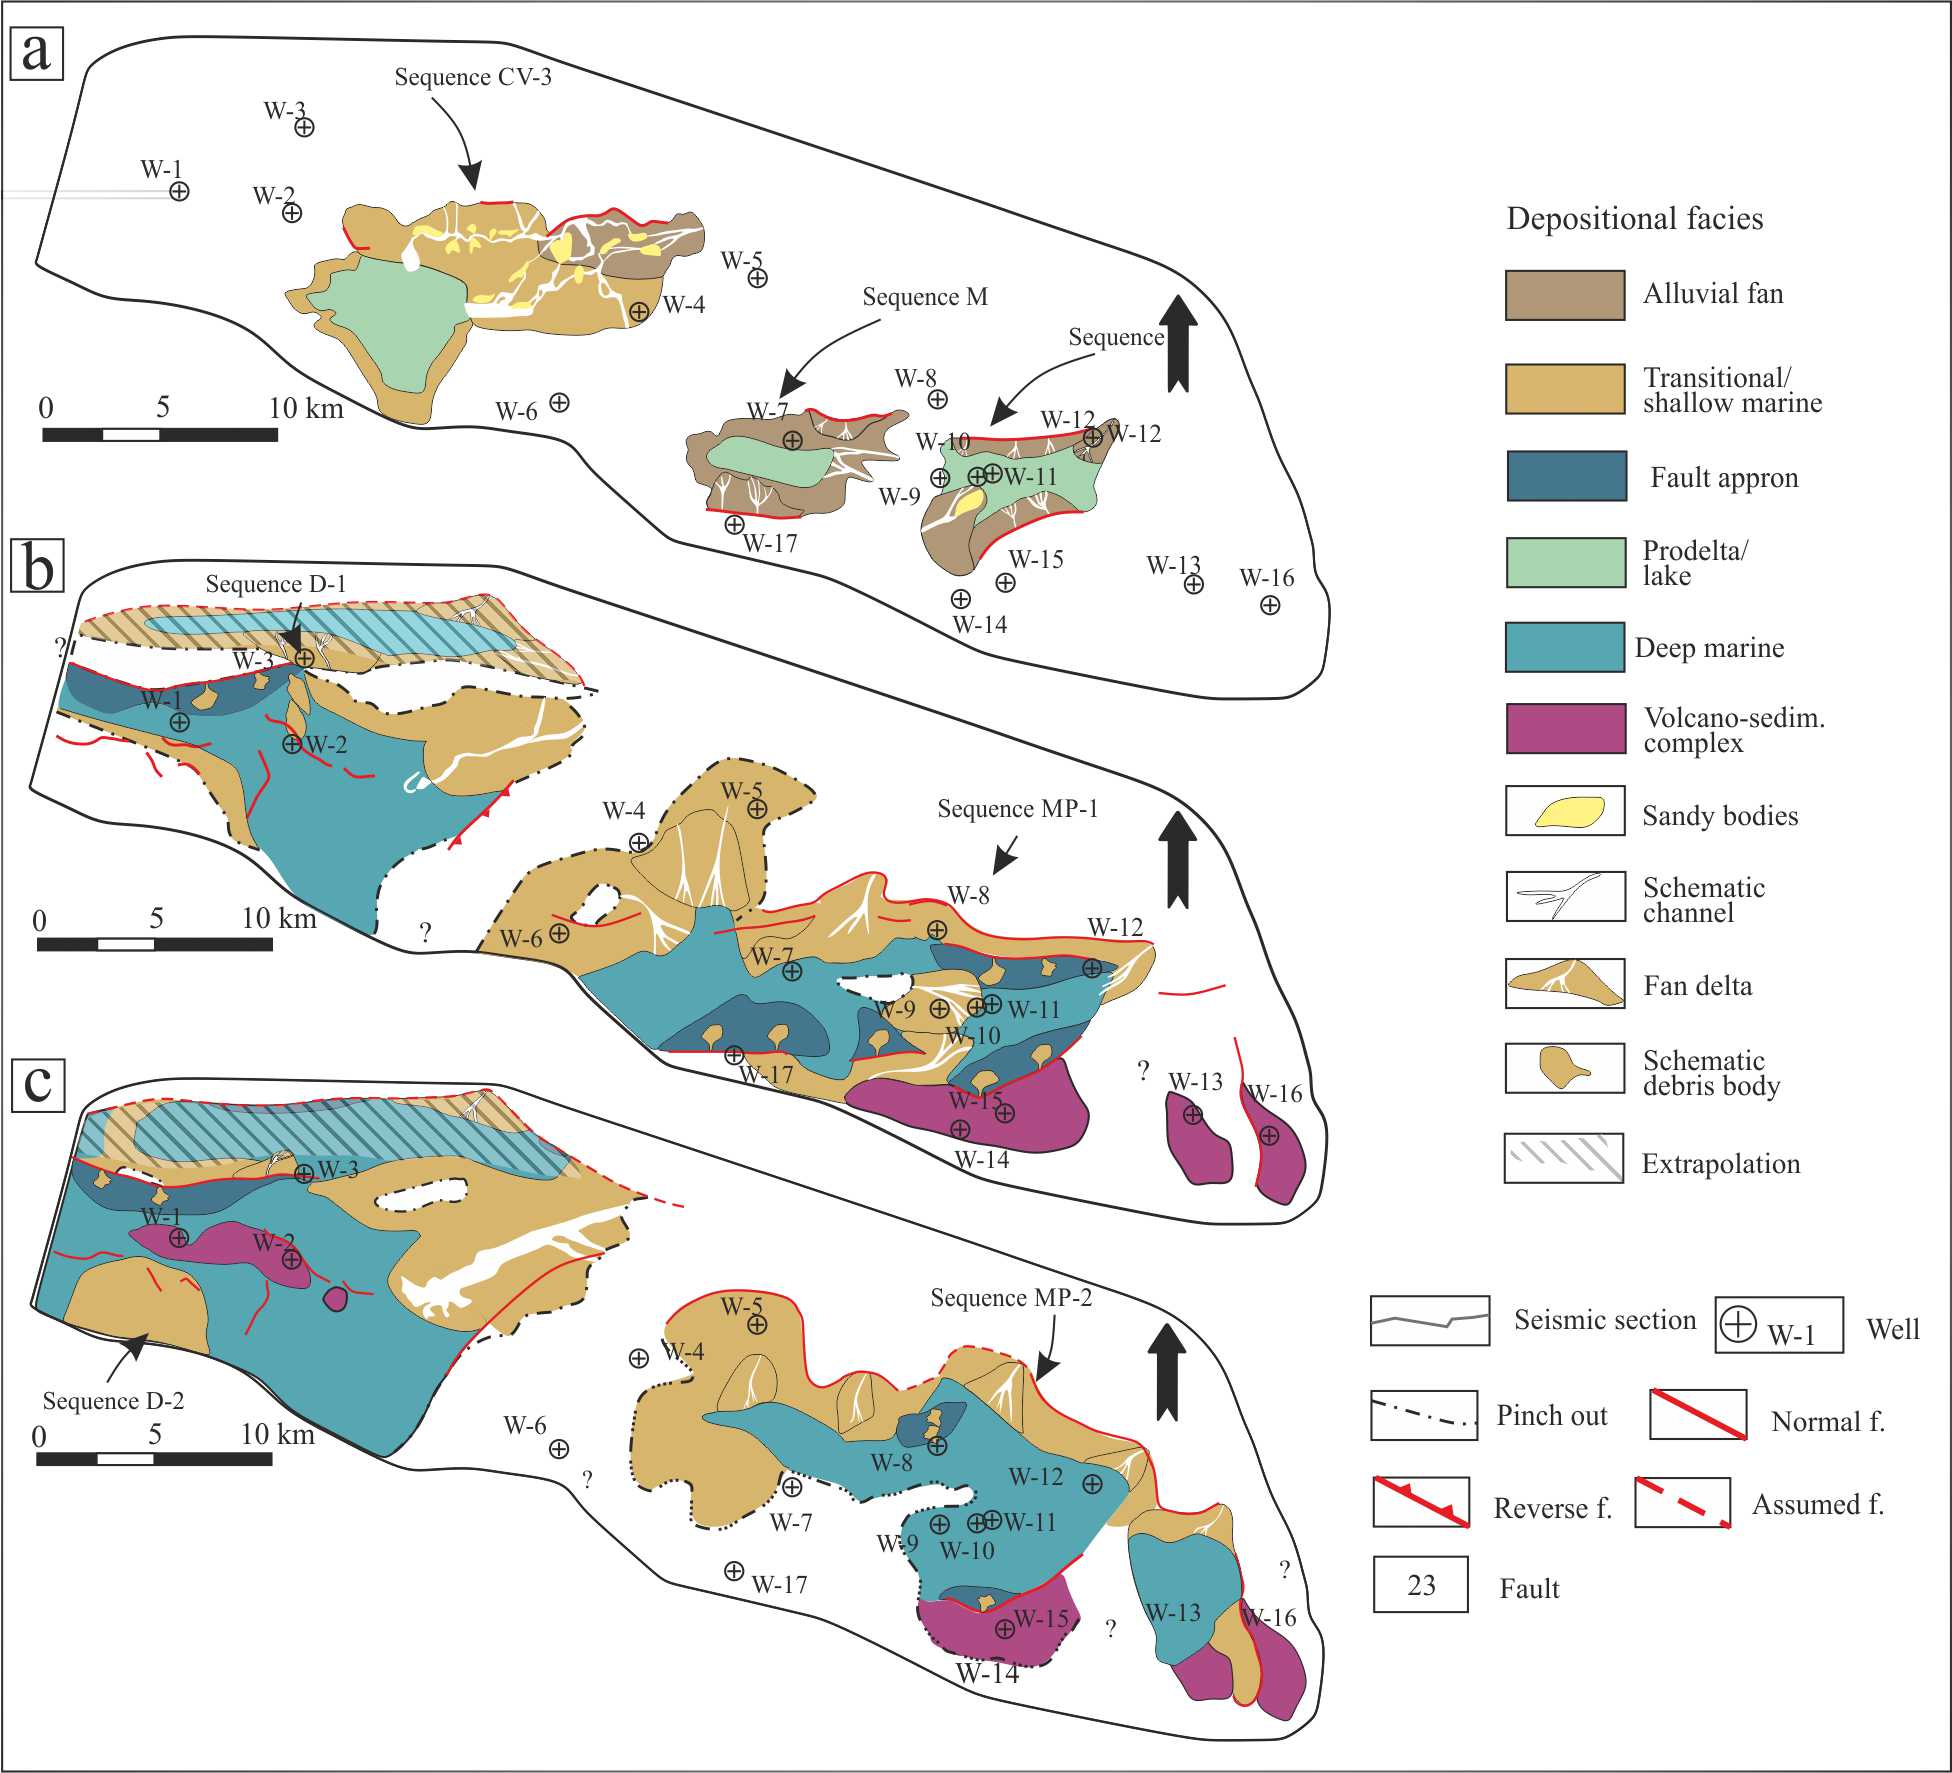
Figure 4. Distribution of the depositional environments of interpreted sequences: a) CV-3, M and S; b) D-1 and MP-1; c) D-2 and MP-2.
Based on the interpretation of seismic data, rift tectonostratigraphic sequences were mapped. The 1st order sequence represents the entire syn-rift infill, and it can be divided into higher order sequences associated with the main fault structures. With respect to tectonic and sedimentary conditions, the defined 2nd order sequences can be divided between spatially restricted sequences associated with continental deposition conditions, formed during lower magnitude of extension, and sequences of wider spread associated with marine conditions, formed during higher magnitude of extension (Figure 4). In the tectonostratigraphic sense, the 2nd order sequences formed during the lower magnitude of extension represent the early syn-rift phase, and stratigraphically correspond to the Early Miocene. The 2nd order sequences formed during the higher magnitude of the extension represent the late syn-rift phase, and stratigraphically correspond to the Middle Miocene, more precisely the Badenian (Figure 5). 2nd order sequences can be further divided into 3rd order sequences corresponding to higher order tectonic events and are the result of local rift activity migration.
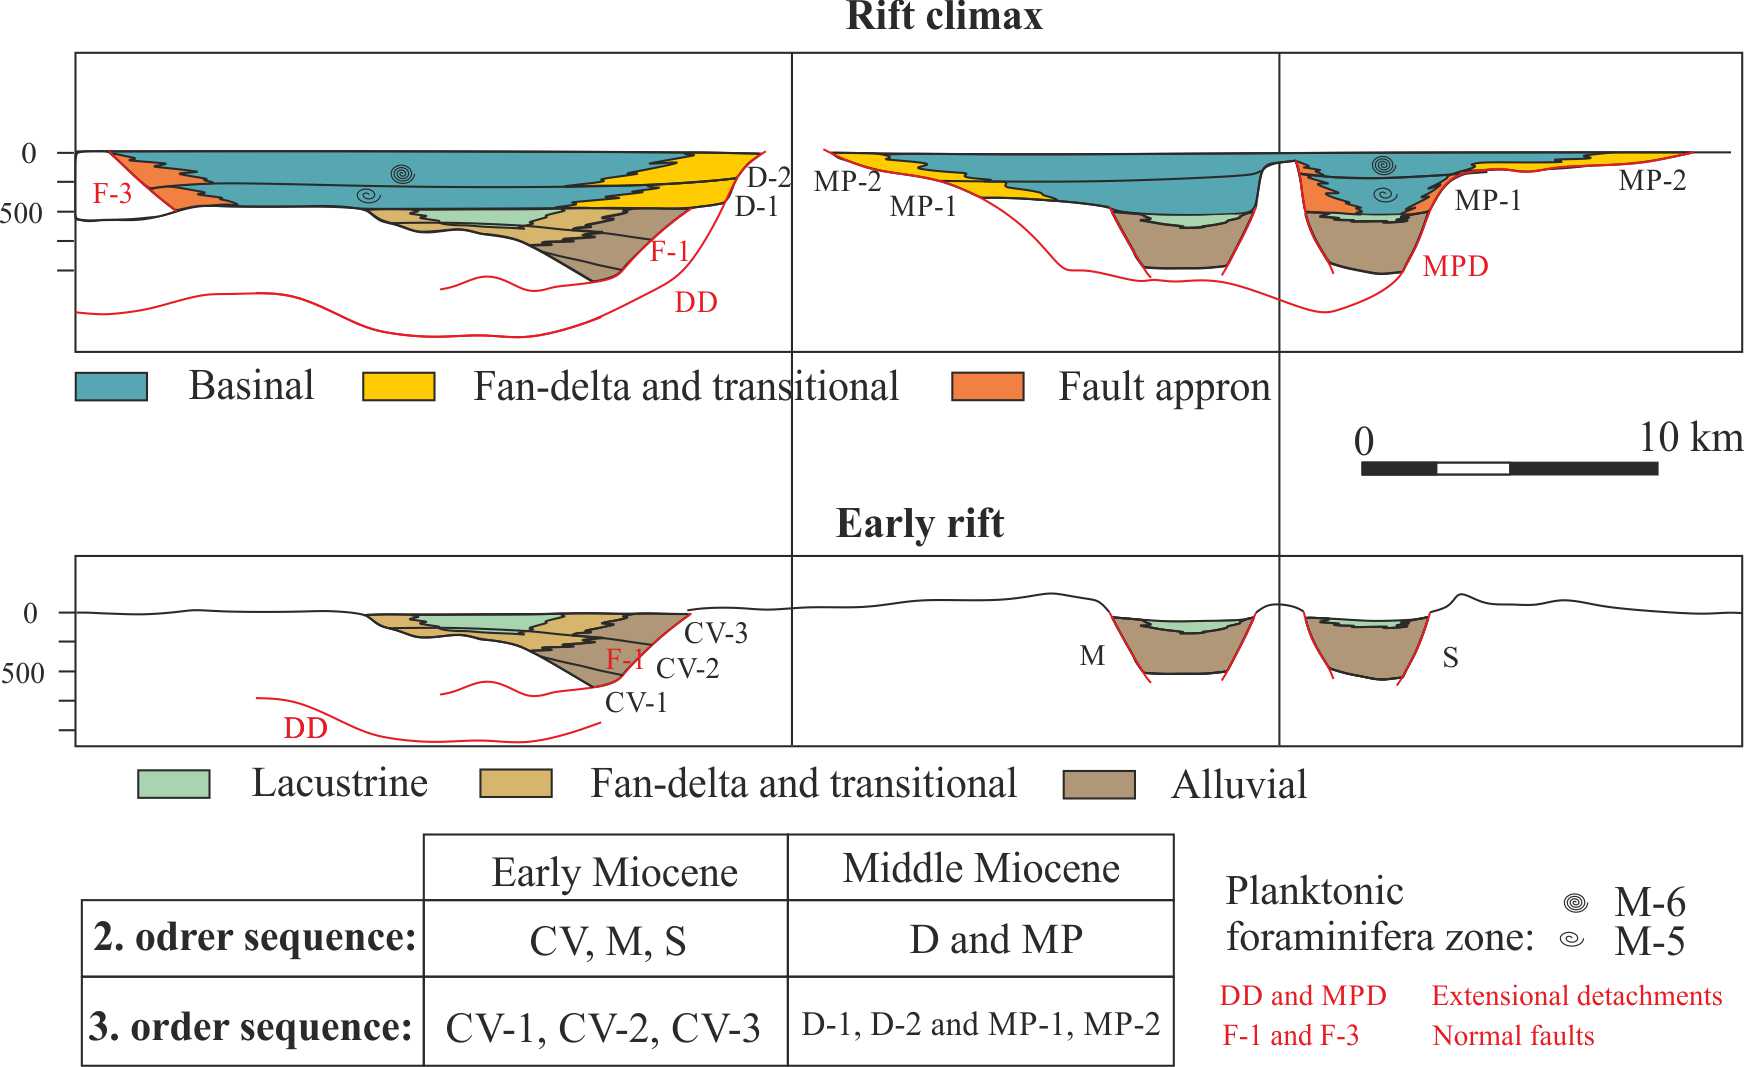
Figure 5. Syn-rift architecture of basins is illustrated on a generalized profile along the eastern part of the Drava Depression.
For the purpose of applying the interpreted tectonostratigraphic sequences for the geological storage capacity of CO2 estimation, the following have been constructed:
- Pressure maps at medium depth of interpreted sequences
- Temperature maps at medium depth of interpreted sequences
- CO2 density maps at medium depth of interpreted sequences
- Facies models of interpreted sequences
- Petrophysical models of porosity distribution of interpreted sequences
- Models of geological storage capacity of CO2 interpreted sequences.
Storage capacity (Q) was calculated according to the expression (Chadwick et al., 2008) for deep saline aquifers (Figure 1):
Q (kg)=A*D*∅ * ρCO2 * hst
where A is the area of the aquifer (m2), D is the total thickness of the reservoir rocks (m), ∅ effective porosity, hst effective storage coefficient and pCO2 density (kgm-3) of pure CO2 in reservoir conditions.
In sin-rift infill deposits, reservoir rocks can be defined within the early sin-rift phase and the late sin-rift phase. They are within the early syn-rift phase i.e., the Early Miocene presented with lithofacies within alluvial fan and fan delta sediments in form of channel features and restricted sandy bodies. Prospective Middle Miocene reservoirs in the late syn-rift phase deposits are represented by lithofacies within coastal environments, fan deltas, and debit deposits of fault slopes. Data from wells as well as the assessment of porosity by the multimineral inverse method of logging measurements indicate that these rocks are characterized by low porosity, mostly up to about 10% (Figure 6).
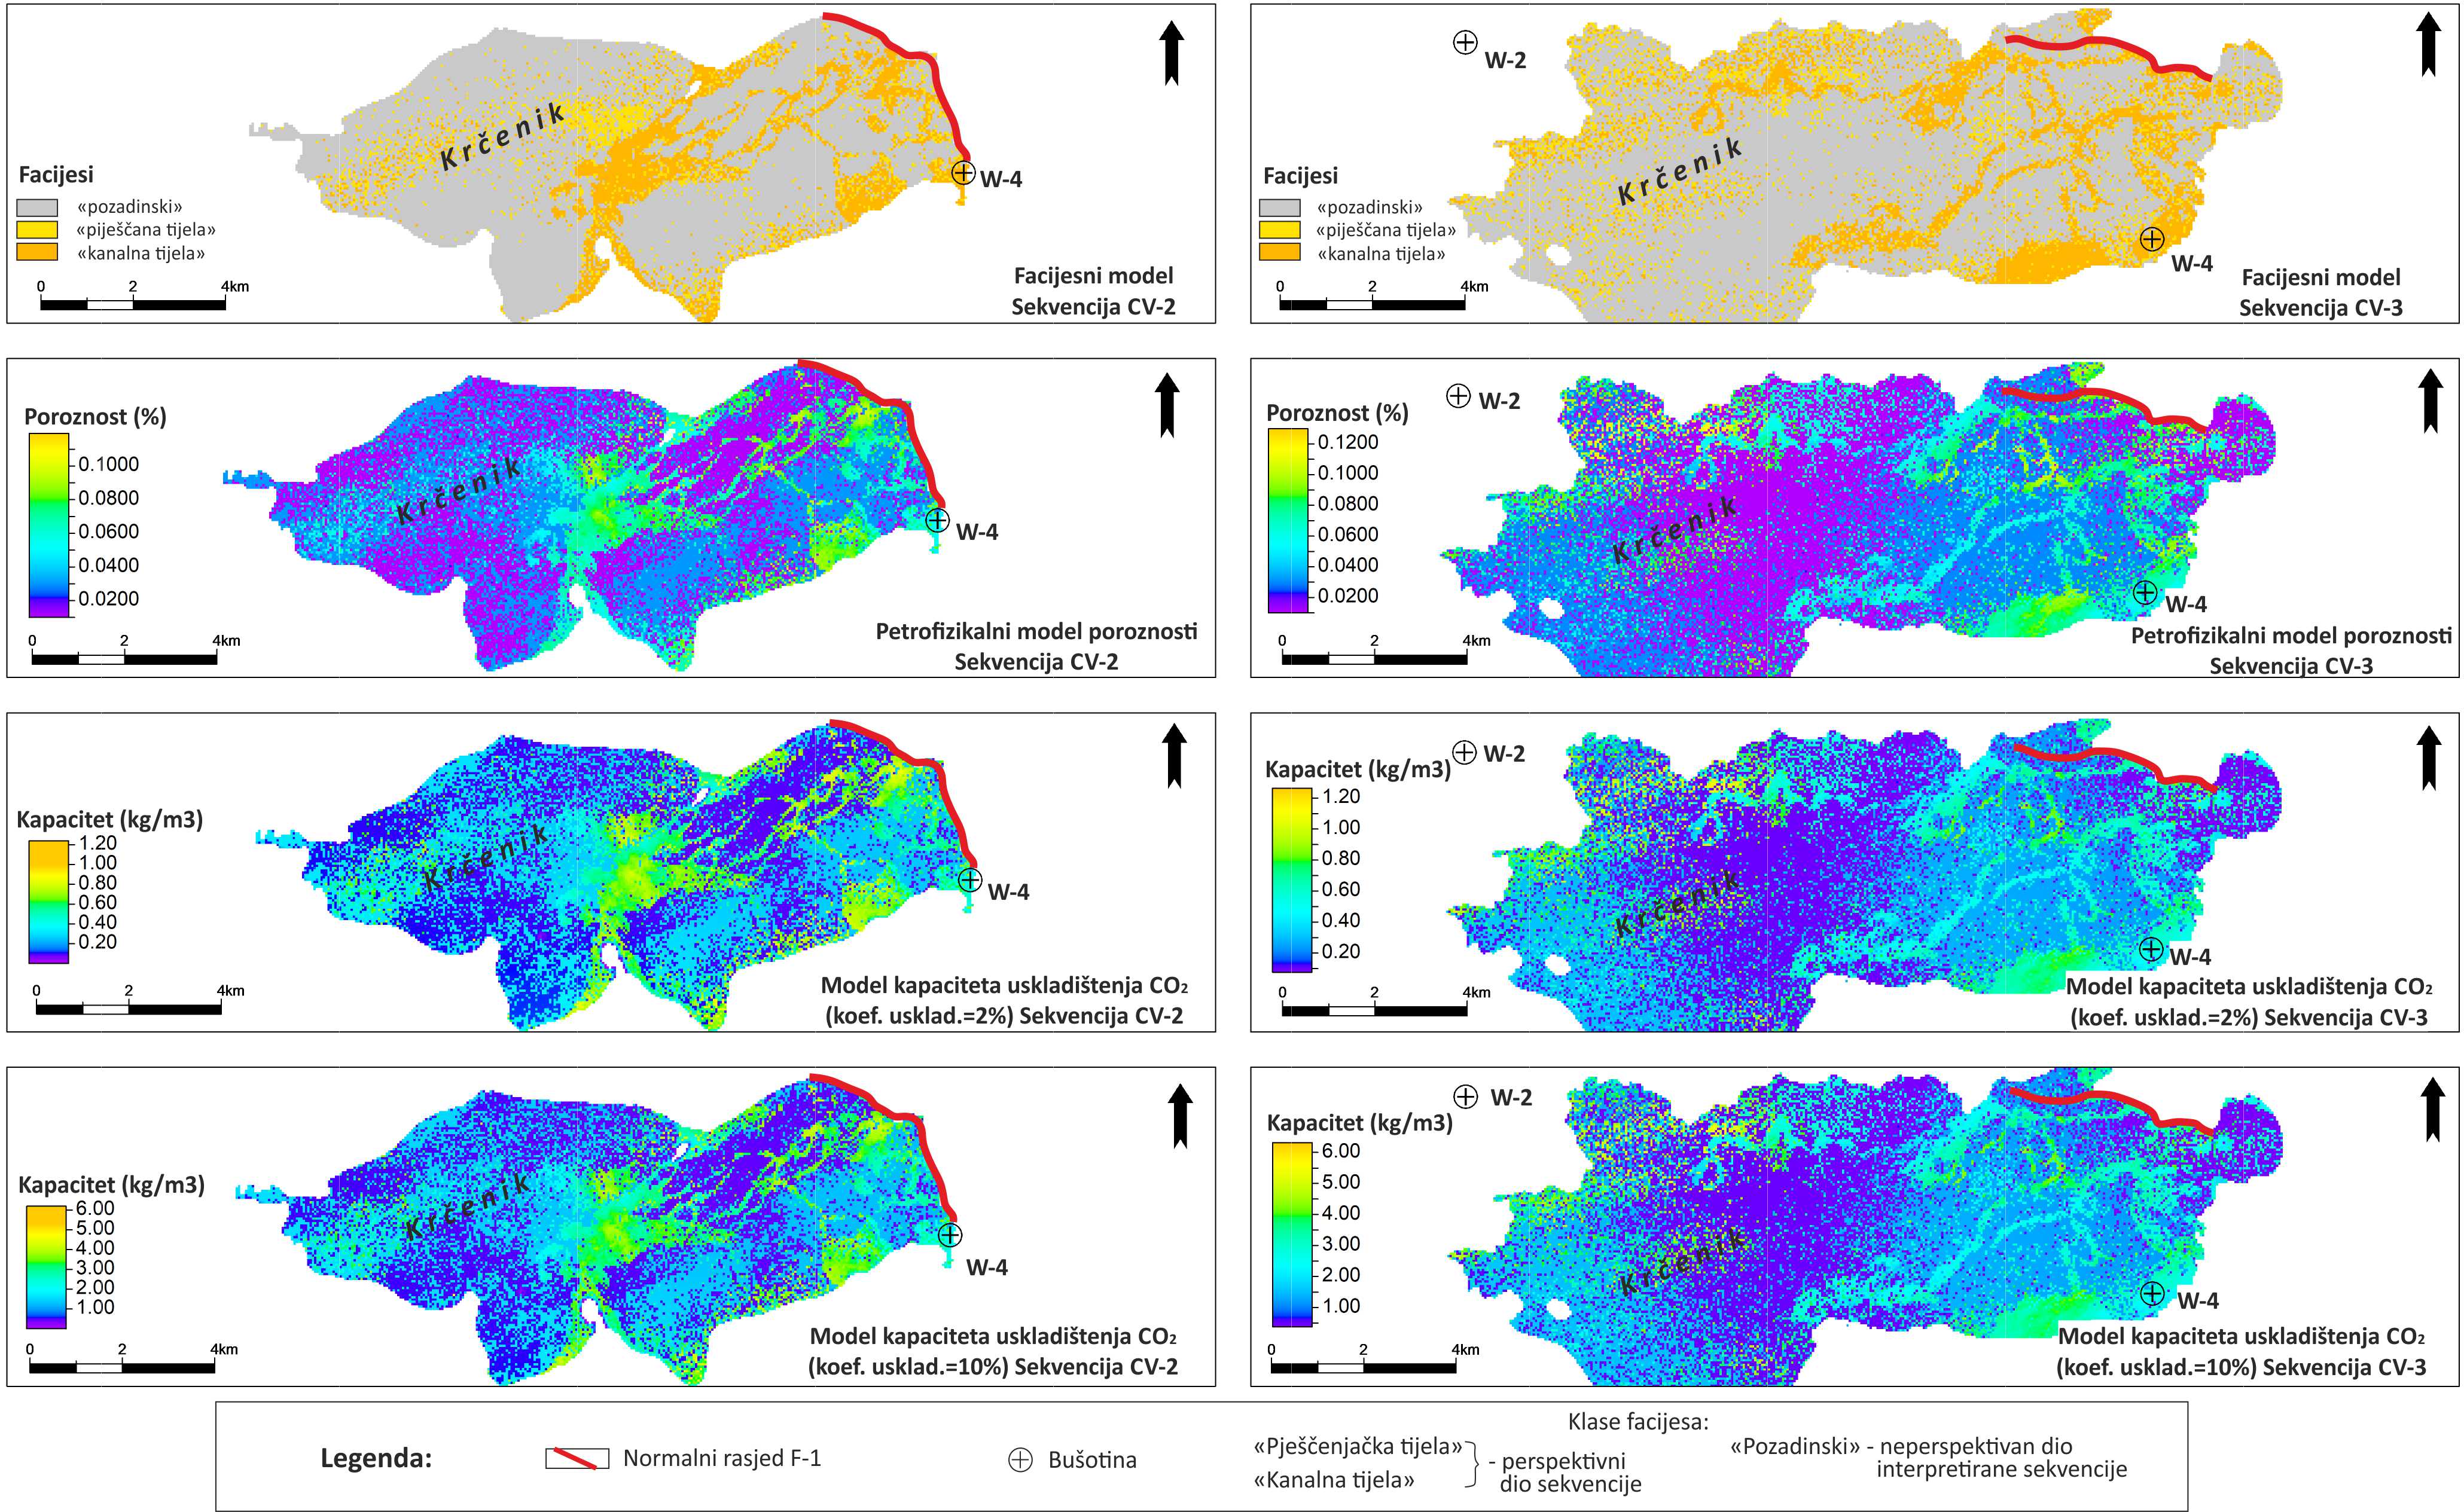
Figure 6. Examples of the projection of three-dimensional facies, porosity and capacity models of the 3rd order sequences CV-2 and CV-3. Compare the distribution of capacity values with the interpreted deposition environments for the sequence CV-3 in Figure 4a.
The research established a methodology for regional assessment of the geological storage potential of CO2 in syn-rift rocks within the continental (passive) rift system. Due to the complexity of the sedimentary infill, as well as the structural setting of the syn-rift basin, a variety of well data and reliable seismic data are required, as well as knowledge of the characteristics of the lithological composition. The methodological approach includes:
- Interpretation of seismostratigraphic surfaces that represent rift tectonostratigraphic boundaries that can be related to the phases of activity of marginal normal faults.
- Mapping of seismofacies, analysis of lithofacies and analysis of paleostructural relationships within the interpreted sequence enables interpretation of environmental distribution, location of potential reservoir rocks and construction of facies model.
- Estimation of the porosity by the multimineral inverse method on well data, which is required for the construction of a petrophysical model.
- Combining the facies and petrophysical model together with the calculated values of CO2 density in reservoir conditions, gives results based on which it is possible to map or model the CO2 specific storage capacity in terms of showing changes in this property in space within each analyzed tectonostratigraphic sequence (Figure 6).
These maps or models can be used to guide exploration, or as a basis for investment decisions in the exploration of this new resource in the deep underground.
Reference:
Buck, W.R., 1988. Flexural Rotation of Normal Faults. Tectonics 7, 959–973. https://doi.org/10.1029/TC007i005p00959
Csontos, L., Nagymarosy, A., 1998. The Mid-Hungarian line: A zone of repeated tectonic inversions. Tectonophysics 297, 51–71. https://doi.org/10.1016/S0040-1951(98)00163-2
Haas, J., 2012. Geology of Hungary. Springer-Verlag Berlin Heidelberg. https://doi.org/10.1016/s1574-8715(07)00020-6
Hodges, K. V., McKenna, L.W., Stock, J., Knapp, J., Page, L., Sternlof, K., Silverberg, D., Wüst, G., Walker, J.D., 1989. Evolution of extensional basins and basin and range topography west of Death Valley, California. Tectonics 8, 453–467. https://doi.org/10.1029/TC008i003p00453
Royden, L., Burchfiel, B.C., 1989. Are systematic variations in thrust belt style related to plate boundary processes? (The western Alps versus the Carpatians) 8, 51–61.
Royden, L.H., 1993. Evolution of retrating subduction boundaries formed during continental collision 12, 629–638.
Tari, G., Horváth, F., Rumpler, J., 1992. Styles of extension in the Pannonian Basin. Tectonophysics 208, 203–219. https://doi.org/10.1016/0040-1951(92)90345-7
Turcotte, D.L., Emerman, S.H., 1983. Mechanisms of active and passive rifting, Developments in Geotectonics. Elsevier B.V. https://doi.org/10.1016/B978-0-444-42198-2.50010-9
Velić, J., 2007. Geologija ležišta nafte i plina. Sveučilište u Zagrebu, Rudarsko-geološko-naftni fakultet.
Wu, Heng, Ji, Y., Wu, C., Duclaux, G., Wu, Hao, Gao, C., Li, L., Chang, L., 2019. Stratigraphic response to spatiotemporally varying tectonic forcing in rifted continental basin: Insight from a coupled tectonic-stratigraphic numerical model. Basin Res. 31, 311–336. https://doi.org/10.1111/bre.12322
Zečević, M., Velić, J., Sremac, J., Troskot-Čorbić, T., Garašić, V., 2010. Significance of the Badenian petroleum source rocks from the Krndija Mt. (Pannonian Basin, Croatia). Geol. Croat. 63, 225–239. https://doi.org/104154/gc.2010.19
PhD David Rukavina, mag. geol., mag. ing. min. is a postdoctoral researches at Department of Geology and Geological Engineering of Faculty of Mining, geology and Petroleum Engineering of University of Zagreb. He received his PhD 21th of July 2021. with thesis: Rift tectonostratigraphic sequences of Lower and Middle Miocene in eastern part of the Drava depression: application of CO2 geological storage assessment
E-portfolio https://moodle.srce.hr/eportfolio/user/view.php?id=8648
ResearchGate David Rukavina (researchgate.net)
Google Scholar https://scholar.google.com/citations?view_op=list_works&hl=en&user=ucGeHgQAAAAJ
CROSBI https://www.bib.irb.hr/pregled/profil/33616
Stranica projekta https://www.rgn.unizg.hr/hr/GEODEP